Make Money Now

Tuesday, 23 June 2020

How To Achieve Financial Freedom ?

Before We Talk About Financial Freedom, We Must First Talk About Money.

What is wealth?

My definition of wealth comes from Robert Kiyosaki.
"Money is not a measure of how much money you have but how long you can live without working."

In other words, money is a measure of time, not money.Having financial freedom means living infinitely longer without working.

There Are Two Ways To Achieve Financial Independence.

# 1 - Make A Lot Of Money :

So much that you cannot spend it in your life.This is the simplest approach to achieving financial freedom. This is what happens in most people's minds.

The question is

How much is enough ?

How long does it take to make those money?

How much effort is required in the process?

What is the opportunity cost in terms of health, family etc.?

Many people work very hard to make money, only to realize that they have lost their health and family in the process.  When they are old with money, it may be too late.

Fortunately there is another way to achieve financial freedom….

# 2 - Make Monthly Passive Income :

Such that your monthly income is more than your monthly expenses, Suppose your total monthly expenses are $ 10,000.

If you can generate passive income of $ 10,000 from businesses, property rentals, stock dividends and / or bond interest, then you have technically achieved financial independence.

This may sound difficult because I have set a high goal of $ 10,000.  If you start with a goal of $ 1k monthly passive income, then getting a few hundreds from each of the sources above is not difficult.

If you can get $ 1k of passive income, then getting $ 10k is a matter of increasing time and time.

Like training your body fitness, your financial fitness will improve as you work on it.

Method # 2 is more practical and achievable, and you are more likely to achieve financial independence at an early age.

If you are very quick, you can already see that the equation has two aspects.

One aspect is your monthly expenses.  Another is your monthly passive income.

If your house and car are paying in full, you can reduce your monthly expenses by perhaps $ 5000.  Then you just need $ 5000 of passive income to achieve financial independence.

But keep in mind that using Method # 2 does not provide any lasting financial freedom.

During an economic crisis, your passive income is likely to decrease significantly, but your expenses are likely to remain the same.

Therefore, it is important to keep reserves and keep your expenses reasonably low.

Also keep in mind that any form of passive income will still require 'work'.

But this 'work' is not an 8 to 5 job, and ideally, it is something you love to do.

I regularly ask myself this question:

"What will I do when I retire?"

If my answer is,

"I'll do what I'm already doing!"

Then I know that I am on the right track!

Build a business around what you are doing and work towards creating your passive income while keeping your expenses reasonably low.  Achieving financial freedom is a matter of time...

To Your Success,
Makemoneynow.online

Beginner's Guide For Traders About Types Of Trading Channels ?

Types Of Trading Channels: 

Trading channels can be very attractive, you just have to know how and where to trade them.

If the price is within a rising channel, then you should only see a place to buy orders.  You should see them when the price hits the bottom of the channel and fast confirmation, maybe a fast-enclosed candlestick.

When the price moves out of an ascending channel you should only be looking to place trades when the price breaks below the channel and not above.  Most times when the price breaks above an ascending channel it becomes fake!  When the price falls below a channel, you should place a sales order when the price is rated by the channel.

When the price is inside a descending channel you should only place orders to sell.  When you reach the top of the price channel and confirm a slowdown, you should keep them.  A recession-filled candle will trigger a full penetration.  When the value moves out of a descending channel, you should only place a trade when it breaks the channel.

Like the ascending channel, it is normally fake when the value falls below a descending channel!

When the price breaks above a descending channel, you should place a purchase order when the price goes out of the channel.

Sunday, 14 June 2020

Beginner's Guide For Traders About Consolidating Markets and Golden Zones ?


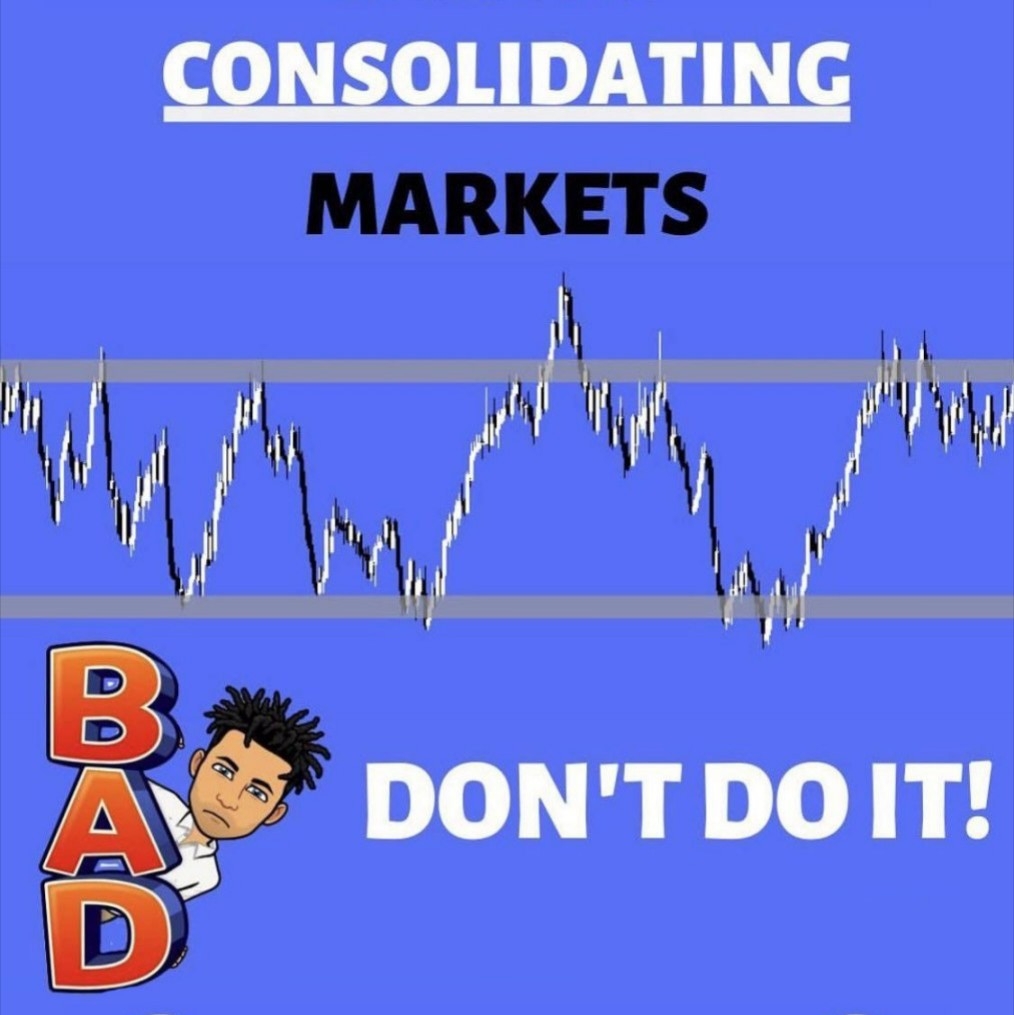
Consolidating Markets, What Are They?

It is a market condition when the price is ranging in between two prices like the image above. 

When the market is Consolidating it is not an optimal time to trade.  You should avoid trading in ranges like above.  The only time trades should be entered is when the price is rejecting the resistance or support zones of the range.

The reasons we do not tend to trade in consolidating markets is because the saying “The Trend is Your Friend” is true. 

There are not as many opportunities in consolidating markets, and when it doubt .. just sit it out!

The Golden Zone …. What Is It?

The Golden Zone is a zone in-between the 0.382 and the 0.618 fibonacci retracement zones.

We call it the golden zone because it is a zone that the price often reverses out of a retracement at and continues in its overall trend. 

In the picture example above, the price came down to the golden zone, 0.618 retracement zone to be exact but all entries inside this golden zone would have been good, valid and profitable entries.

Work on spotting that golden zone and looking for confirmations of an entry!

DO NOT just enter because the price has come into the zone, look for other signs such as candlestick patterns, increased momentum etc.

Do you look for the golden zone when trading? 

#Trading #education

Beginner's Guide For Traders About The Retest Support and Resistance ?


A Retest is when the price breaks out of a structure and then comes back up to touch it before continuing on its original breakout direction.

In the example above the price broke beneath a support zone, but then it came back up to test the zone as a resistance zone before dropping further.

When the price tested the newly made resistance zone, this is where our retest of the breakout was.  When a breakout occurs, the best place to enter a breakout trade is at the retest of the structure which has just been broken. 

The price does not always retest the structure after a breakout, we like to say - NO RETEST= NO TRADE..

Support & Resistance Zones are the base of technical analysis.  Here's a couple of tips on how to draw them and use them in the correct way.

Firstly S/R ZONES are ZONES not lines.  We see many charts with lines as their S/R zones, this limits the size of the supply and demand range, also limiting your trading area.

Secondly, a support and resistance zone needs to make at least 3 tests to make it valid.  A structure with 3 or more tests confirms it is actually there.  Many new traders get trapped because they trade based on invalid zones.  We hope this helps you improve your S/R zone drawing and trading.

#Trading #education

Beginner's Guide For Traders About Spotting Trend Reversals ?

Spotting Trending Reversals ?

Knowing how to spot a trend reversal is important in trading.  

Finding trend reversal trades are the most profitable and it cannot be argued.  It’s a fact, there is no larger space of price action than a trend!

The first way you can spot a change in trend is by spotting a change in flow of higher highs and higher lows into lower highs and lower lows.  This is shown in the image above. 

Another way to spot a change in trend is by looking for major structures.  The most common, which cause change in trends, are support and resistance zones, breakout of trend-lines and channels.

The Three Inside Up candlestick pattern is a great way to spot reversals!!

The Three Inside Up Candlestick Patterns are reversal patterns that occur at the bottom of down trends. The first candle should be found at the bottom of a downtrend and is characterized by a long bearish candlestick. The second candle should at least make it up all the way up to the midpoint of the first candle. The third candlestick needs to close above the first candle s high to confirm that buyers have overpowered the strength of the downtrend.

The Three Inside Down candle stick pattern is also a great way to spot reversals!!

Three Inside Down Candlestick Pattern three inside down candlestick pattern is found at the top of uptrends and they suggest a bearish reversal.  the first candle should be found at the top of an uptrend and is characterized by a long bullish candlestick. The second candle should make it up all the way down the midpoint of the first candle. The third candlestick needs to close below the first candle to confirm that sellers have overpowered the strength of the uptrend.

Taking a counter based trade on just one of these confluence is NOT a very good idea at all.  If let’s say you get 2-4 of these confluences it would be a good idea to look for a trade entry.!


#Trading  #education

Beginner's Guide For Traders About Bearish Engulfing Candlesticks ?

The Bearish Engulfing Candlestick pattern can be very powerful if you identify them in the right place. 

Before we get onto where to find them, you need to know what they look like first.  When the price is rallying upwards and forms a candle which closes below the open of the previous candle, like the image above, that is a bearish engulfing candle.

This candle tells us that the bears (sellers) have taken over the market, but only tells us if this occurs at a significant zone in the market.  In this case, if a bearish engulfing candle occurs at a resistance zone, it’s a valid sell signal.

This candlestick does work better with higher timeframes, so it will be more effective on the daily chart and 4H chart rather than the 1H and 15M chart.

These candlesticks can suggest a retracement (pullback), that’s why it’s important to look for them at zones.  This will give you a confirmation that the price is reversing and that the bears are taking over!

#Trading #education

Beginner's Guide For Traders About Bullish Engulfing Candlesticks ?

Who has used this pattern before?

Bullish engulfing candlesticks are the opposite of bearish engulfing candlesticks.

They can be very powerful if used in the correct way.

When the price is trending down and reaches a support zone, this is a great pattern (confirmation) to look for.  It tells us that the bulls (buyers) have taken control of the market.

The bullish engulfing candlestick pattern consists of a bullish candle closing higher then the open of the previous bearish candle like we have shown in the image above. 

When you see this candlestick pattern at a support zone it is a valid buy signal!

Remember, this candlestick pattern is only valid at zones, trend lines and fibonacci zones, if it occurs in a random spot in the market (no mans land) then it could just be a pull back (retracement)

#Trading #Education